Tutorial 2: Customised District
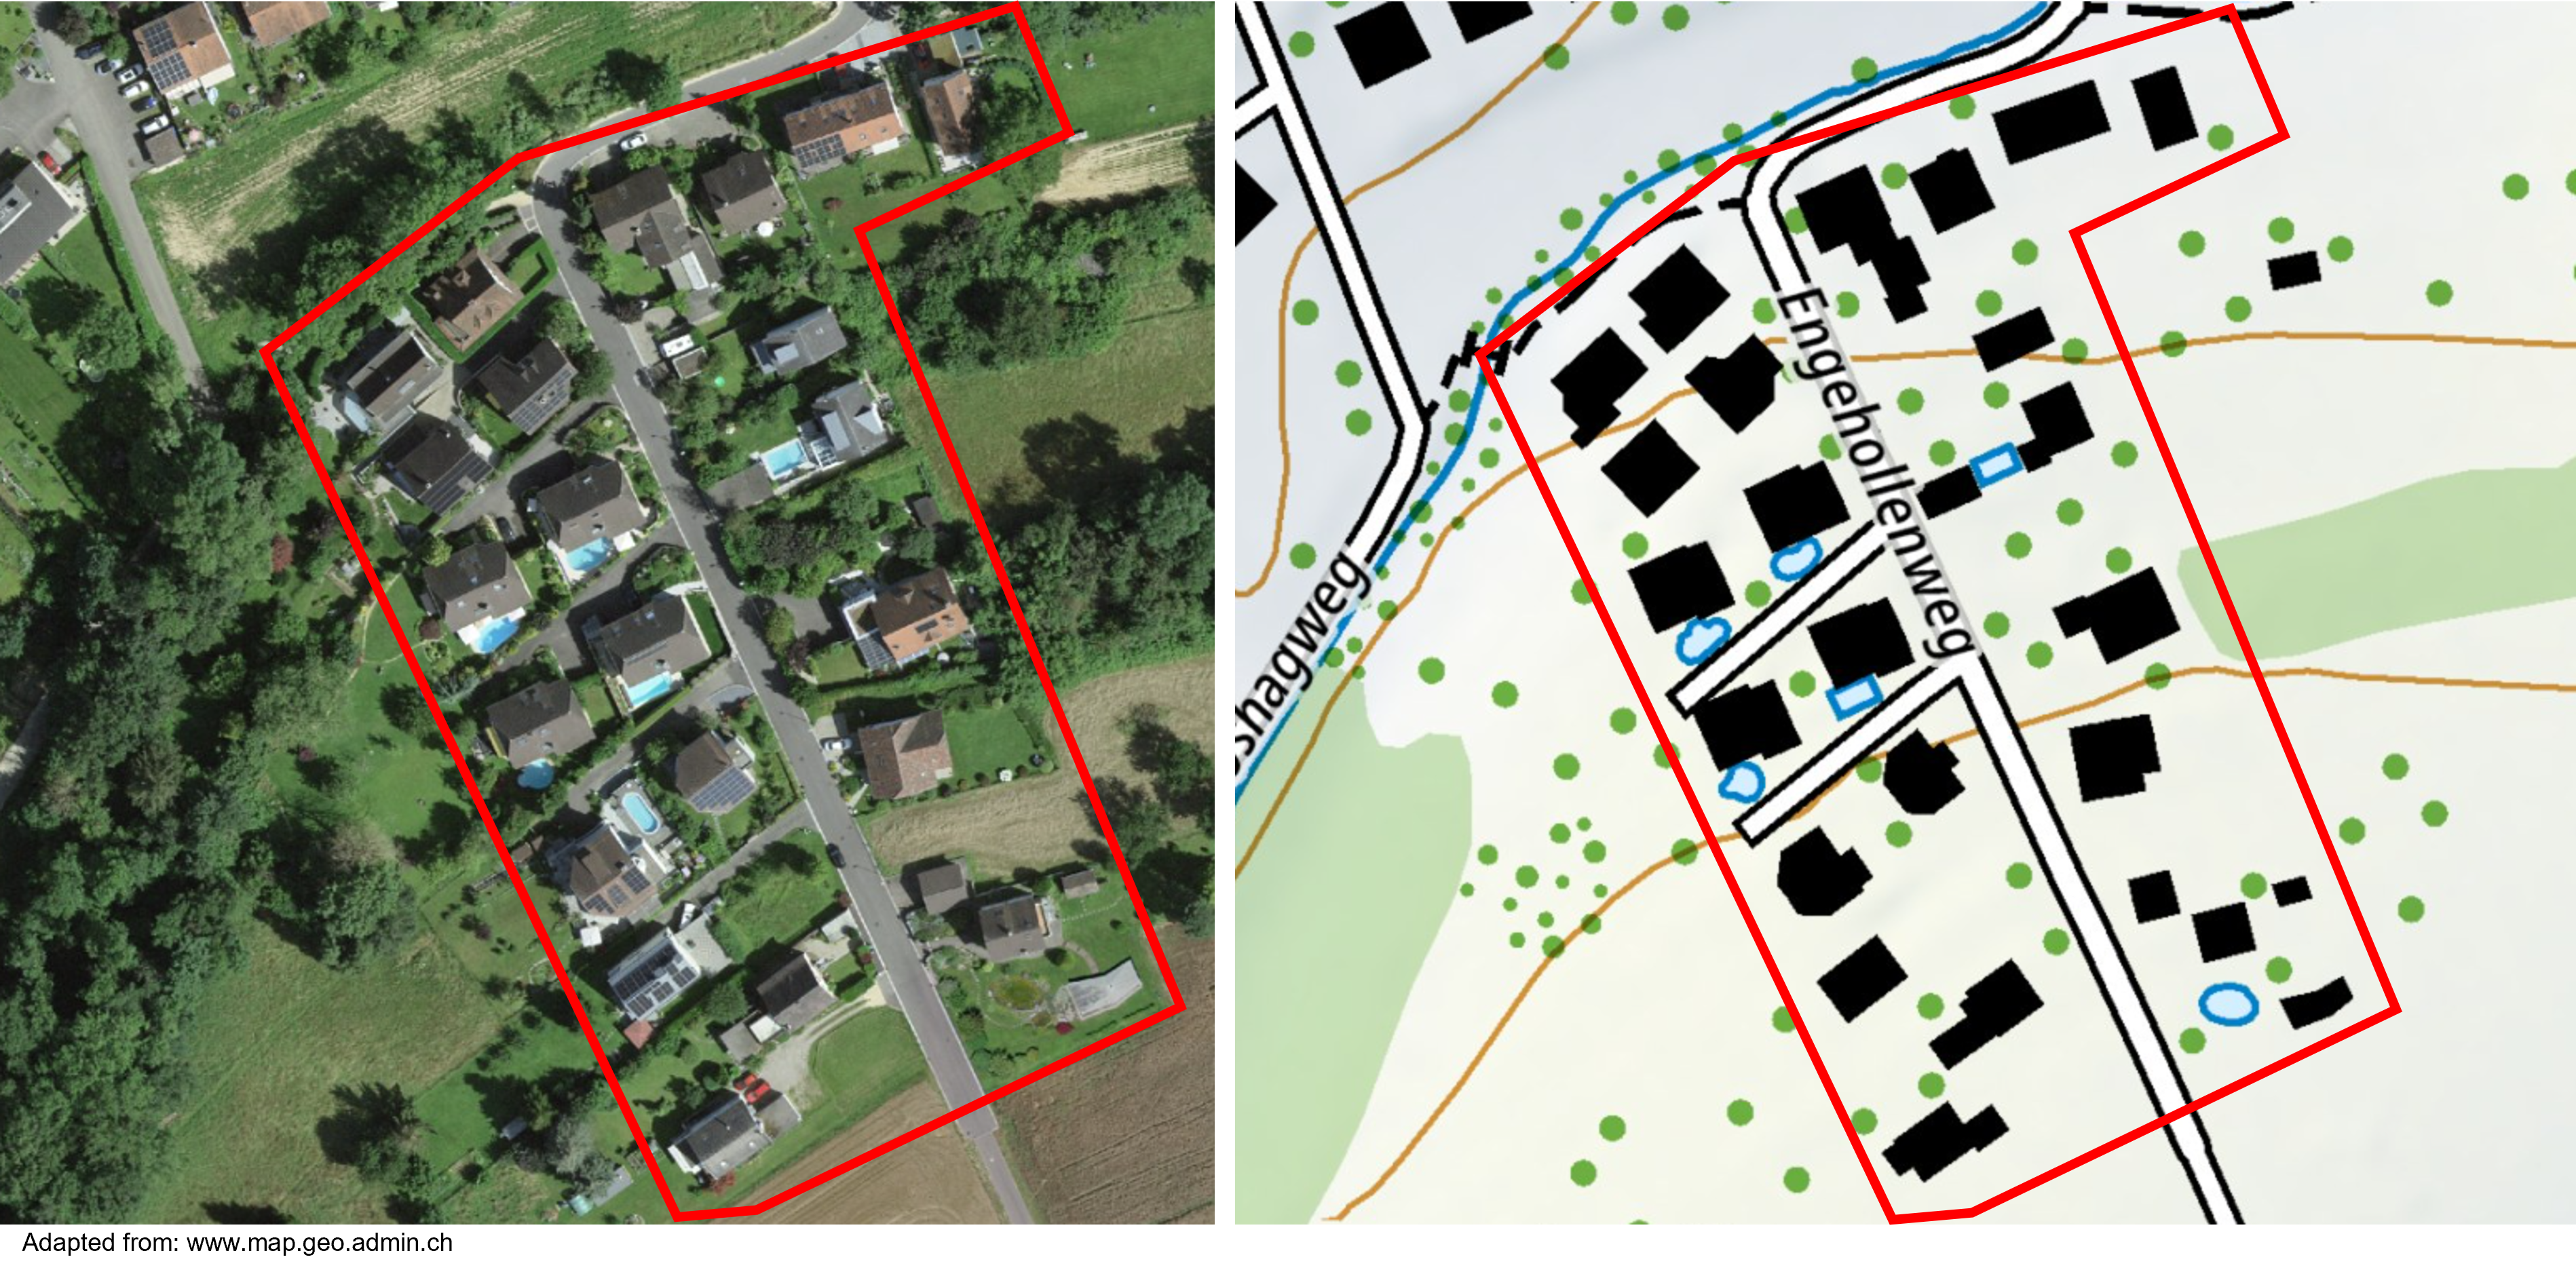
This tutorial builds a district energy simulation for a small district consisting of 30 buildings, predominantly residential. While Tutorial 1 models the entire municipality of Allschwil, this tutorial focuses on a selected subset of buildings within the same municipality (see figure below).
The same two scenarios as in Tutorial 1 are simulated. The only difference is the size of the thermal energy storage system.
Baseline scenario: Current energy demand and supply configuration.
Electrification scenario:
Heating electrification: Replacement of 80% of existing fossil-based heating systems (oil and gas boilers) with heat pumps.
Solar PV integration: Deployment of 80% of the remaining rooftop solar photovoltaic potential.
Thermal energy storage: Implementation of decentralised thermal energy storage systems with a total storage capacity of 30 MWh, charged and discharged by heat pumps.
No optimisation is performed.
Prerequisites
(skip if already completed previously)
Install DEM following the installation instructions.
Create a project directory (arbitrary name, referred to as project_dir) with the structure described in Running a Simulation, containing the following sub-directories:
project_dir/dataproject_dir/config/config_files
Data setup
(skip if already completed previously)
Download the Swiss input data package from Zenodo.
Extract the archive and copy its contents into the data directory, preserving the original folder hierarchy as downloaded from Zenodo.
Configuration: baseline scenario
Create the simulation.yml configuration file with the following content:
number_of_days: 365
district_number: 0
generate_plots: true
save_results: true
When modelling a cutom district, the district_number parameter is no longer used, as the model automatically determines the district from the provided building list. It is therefore set to 0 here, although any arbitrary value would be accepted.
To define a custom district, the included buildings must be specified in the meta_data.yml configuration file:
custom_district:
implemented: true
EGID_List: [2348043, 245063143, 2348044, 2348045, 391986, 391987, 391988, 391989, 391993, 391990, 391994, 245025839, 245025840, 391992, 245025841, 245025842, 391995, 391996, 391997, 2348046, 3029563, 391998, 245046103, 391999, 245025843, 245045313, 245046052, 392000, 245027525, 3029067]
custom_district_name: 'tutorial_2_district'
The EGID numbers identifying individual buildings can be obtained from the Swiss geodata portal.
Place both simulation.yml and meta_data.yml in the config/config_files directory.
Running the simulation: baseline scenario
Open an Anaconda prompt and navigate to project_dir.
Activate the DEM environment (name depends on the installed version):
conda activate dem_0_1_0_rc0
Start the simulation:
district_energy_model
Outputs: baseline scenario
After completion, DEM creates a dem_output directory inside project_dir.
This directory contains result files and generated plots.
Selected outputs for the baseline scenario of the custom district are shown below as interactive plots:
Configuration: electrification scenario
For the electrification scenario, several default parameters are modified, following the same approach as in Tutorial 1. The file simulation.yml remains identical to the baseline configuration:
number_of_days: 365
district_number: 0
generate_plots: true
save_results: true
In order to activate the three measures heating electrification, solar PV integration, and thermal energy storage, create the scenario configuration file scenarios.yml with the following content and place it in project_dir/config/config_files:
fossil_heater_retrofit: true
pv_integration: true
thermal_energy_storage: true
Activating these measures requires corresponding adjustments to technology parameters:
Heating electrification replaces 80% of installed oil and gas boilers with heat pumps.
Solar PV integration activates the use of 80% of the remaining available rooftop PV potential.
Thermal energy storage (TES) introduces decentralised storage systems operated in conjunction with individual heat pumps.
Only technology parameters that deviate from default values must be specified. Create the technologies configuration file with the following content and place it in project_dir/config/config_files:
oil_boiler:
replacement_factor: 0.8
gas_boiler:
replacement_factor: 0.8
solar_pv:
potential_integration_factor: 0.8
tes_decentralised:
deployment: true
capacity_kWh: 30000
The heat pump technology is already deployed by default in the baseline scenario. Therefore, no changes are required and it does not need to be included in the technologies configuration file.
The following technologies are modified:
oil_boiler: The oil boiler technology is deployed by default, so thedeploymentparameter is omitted. The defaultreplacement_factorof 1.0 is reduced to 0.8.gas_boiler: The gas boiler technology is deployed by default. As with oil boilers, thereplacement_factoris reduced from 1.0 to 0.8.solar_pv: The solar PV technology is deployed by default. Thepotential_integration_factoris increased from the default value of 0.3 to 0.8.tes_decentralised: The decentralised thermal energy storage technology is disabled by default. It is activated by settingdeploymenttotrue. The total storage capacity is defined usingcapacity_kWhand is set to 30 MWh (30’000 kWh). Notice that this value is smaller than in Tutorial 1 because the district is smaller.
Running the simulation: electrification scenario
The simulation procedure is identical to the baseline scenario.
Open an Anaconda prompt and navigate to project_dir.
Activate the DEM environment (name depends on the installed version):
conda activate dem_0_1_0_rc0
Start the simulation:
district_energy_model
Outputs: electrification scenario
After completion, DEM creates a dem_output directory inside project_dir.
This directory contains result files and generated plots.
Selected outputs for the electrification scenario of the custom district are shown below as interactive plots: